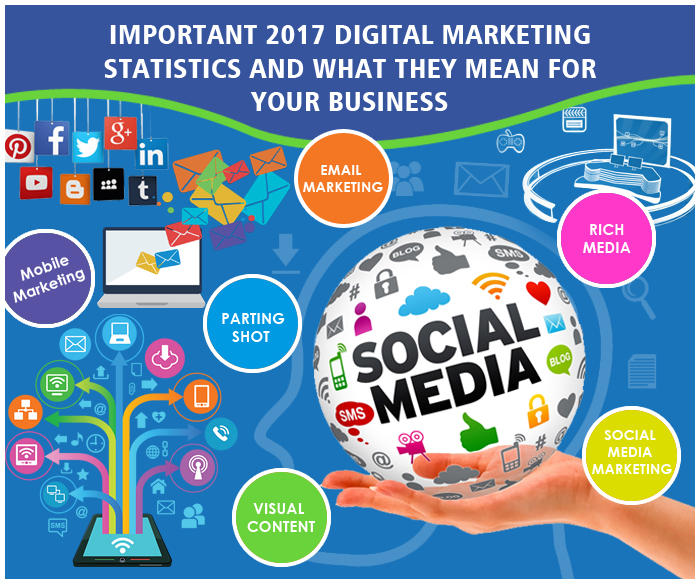
Digital marketing and the internet by extension is constantly morphing which is why it is essential to keep up with current trends and statistics. Statistics are especially useful because they can inform the direction of a digital marketing campaign. A well informed advertiser is able to outperform his competition and give him that extra edge he needs to get to and remain at the front of the pack.
Here are some of the most significant 2017 digital marketing statistics and tips on how to translate this information to your business success.
Content Marketing
- 41% of digital marketers believe in the effectiveness of webinars (DemandWave)
- 72% of digital marketers name relevant content as the number one SEO strategy (Ascend2)
- 93% of businesses rely on social media as the primary means of getting content to audiences (Content Marketing Institute)
Translating the Stats to Your Business
It is clear that your focus should be on relevant and high-quality content. This approach also influences SEO, referrals, traffic, conversion and visibility. You can start by finding out the trending topics in your industry and using this to inform the content that you should be putting out.
Social Media Marketing
- 14% of shoppers rely on advertisements to make purchase decisions while 93% look report some kind of influence from social media (Socialnomics)
- 57% of shoppers report a positive bias towards businesses with positive online reviews and recommendations (Direct Marketing)
- 34% of marketers report the intention to advertise more on Amazon while 36% on Snapchat, 42% on Pinterest, 62% on Facebook and 72% on Instagram (MediaPost)
Translating the Stats to Your Business
There is no getting around social media presence. Having a strong social media presence is no longer a luxury but a necessity. Although you don’t have to be on all social media platforms, you should commit to advertising in at least one. This is especially important if you are targeting millennials and tech-savvy demographics.
It might be time to allocate a proper social media marketing budget if you haven’t already. It is also necessary to hire an expert if the budget allows. If this isn’t immediately possible, you can start small by engaging with your audience on the comment section.
Visual Content/Rich Media
- Infographics are the most shared and liked type of content on social media (Mass Planner)
- Most consumers would rather watch a video rather than read about a product (Animoto)
- 48% of marketers report eyeing YouTube as part of their digital marketing strategy in the next year (HubSpot)
Translating the Stats to Your Business
Videos, images and infographics are best for capturing an audience’s attention within the barrage of information available to the average consumer. Rich media is also more likely to go viral, shared or liked.
You can start right at home by including visual media right on your business website. You should also have video alternatives for your products or services as well as text content for those inclined to reading.
It is also worth thinking about a YouTube channel to promote your brand depending on the size of your business and the products you are selling.
Mobile Marketing
- 80% of web surfers own a smartphone (Smart Insights)
- There is a 22% increase in the number of businesses optimizing email for mobile (Adestra)
- 63% of small businesses plan to optimize their websites for mobile (ReachLocal)
Translating the Stats to Your Businesses
More than ever, consumers are using their smartphones and mobile devices to find information and make purchases.
If you don’t have a mobile optimized website, it is a matter of necessity if you want to compete in your area of business. It is also worth thinking about a mobile app for your business that consumers can use to interact with and enjoy being a part of your brand.
Email Marketing
- Transactional Emails bring in the most revenue for all types of email, and have the largest clicks and opens (Campaign Monitor)
- Emails campaigns are six times more likely to be clicked-through compared to tweets (Campaign Monitor)
Translating the Stats to Your Business
Users signing up to your newsletter or leaving their email is an indication that they want to be a part of your brand. This is a sign of faith that you are going to deliver relevant and insightful information about your product and services. Don’t break this trust and rather leverage it by sending consistent, valuable and strategic content in your emails. This is one of the easiest ways to build trust with your customers and build your brand as an authority in your field of business.
Parting Shot
If your digital marketing campaign includes social media, mobile optimization, email marketing and rich media; you are on the right track. If not, use this information to tweak your digital marketing campaign to boost effectiveness.
The good news is that you don’t have to do everything all at once. Most of your competition is unaware or not fully milking the digital marketing cow, meaning every little bit of forward movement on your part helps.
Finally, keep up with digital marketing statistics to ensure that your marketing campaign is built on solid ground. The internet is a dynamic and ever changing place and only the best informed marketer is able to survive the competition’s onslaught.


 +91 9718184875
 info@ethicalseosolutions.com

